In this (first) tutorial, we are going to learn how to use Visualization Tool Kit (VTK) to implement the visualization component of a CAS surgical navigation system.
More examples and tutorials can be found here
To begin with, we need to import all the necessary Python functions and external libraries:
import math
import numpy as np

# noinspection PyUnresolvedReferences
import vtkmodules.vtkInteractionStyle
# noinspection PyUnresolvedReferences
import vtkmodules.vtkRenderingOpenGL2
from vtkmodules.vtkCommonColor import vtkNamedColors
from vtkmodules.vtkCommonTransforms import vtkTransform
from vtkmodules.vtkFiltersSources import vtkSphereSource
from vtkmodules.vtkRenderingAnnotation import vtkAxesActor
from vtkmodules.vtkRenderingCore import (
    vtkActor,
    vtkPolyDataMapper,
    vtkRenderWindow,
    vtkRenderWindowInteractor,
    vtkRenderer
)
In VTK,
A vtkRenderWindow is a window in a graphical user interface (GUI) where a renderer draw their images,
A vtkRenderer is an object that controls the rendering process of objects, and
A vtkRenderWindowInteractor provides an interaction mechanism better users (i.e. mouse inputs) and the render window
# Visualization Pipeline

# a renderer and render window
ren = vtkRenderer()
renWin = vtkRenderWindow()
renWin.SetWindowName('AISE 4025: point and axes')
renWin.SetSize( 640, 480 )
renWin.AddRenderer( ren )

# an interactor
iren = vtkRenderWindowInteractor()
iren.SetRenderWindow( renWin )
A geometrical primitives such as a point and a line is created by
a source, i.e. its mathematical description
a mapper, an object that translates the source to,
an actor, the final object that is to be rendered in the renderer. For geometrical objects, they are typically a set of connected triangles
colors = vtkNamedColors()

# Create a sphere to represent a point
point = np.array([0, 5, 0])         # position of a point

# use a sphere with a finite size to visualiza a point, since a point, by definition, has no size
sphereSource = vtkSphereSource()
sphereSource.SetCenter( point.tolist() )
sphereSource.SetRadius( 0.5 )       # an arbitrary size

# create a mapper
sphereMapper = vtkPolyDataMapper()
sphereMapper.SetInputConnection( sphereSource.GetOutputPort() )

# create an actor
sphereActor = vtkActor()
sphereActor.SetMapper( sphereMapper )
sphereActor.GetProperty().SetColor( colors.GetColor3d('Red') )
We can add a 3D axes to help us orient
# add an 3D Axes
axes = vtkAxesActor()
axes.SetTotalLength(10,10,10)
axes.AxisLabelsOff()

# properties of the axes labels can be set as follows
# this sets the x axis label to red
axes.GetXAxisCaptionActor2D().GetCaptionTextProperty().SetColor(colors.GetColor3d('Red'));
axes.GetYAxisCaptionActor2D().GetCaptionTextProperty().SetColor(colors.GetColor3d('Green'));
axes.GetZAxisCaptionActor2D().GetCaptionTextProperty().SetColor(colors.GetColor3d('Blue'));
Add all actors to the renderer so the renderer knows what to draw.
# Add the actors to the scene
ren.AddActor( sphereActor )
ren.AddActor( axes )
ren.SetBackground( colors.GetColor3d( 'MidnightBlue') ) # the color can be specified as a name
ren.SetBackground( .1, .2, .4 )                         # or as RGB
ren.SetBackground( 1, 1, 1 )                            # this is white
ren.ResetCamera()
Draw onto the render window and start the user interaction.
renWin.Render()
iren.Start()
A window will pop up:
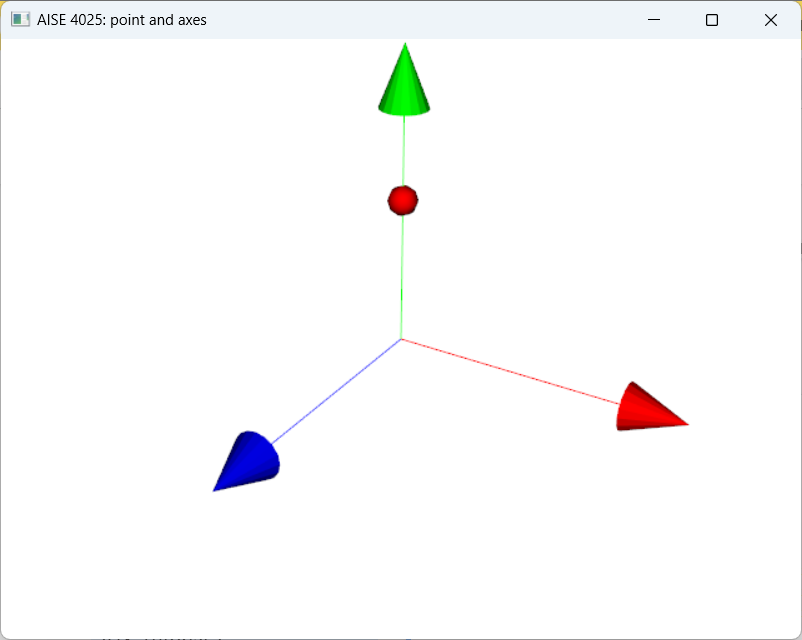
Figure 1:A point visualized as a red phere in 3D.
Use the mouse to change the viewing angle!
Press ‘q’ to exit