In this (second) tutorial, we are going to graphically visualize the operation of adding (summing) two vectors.
More examples and tutorials can be found here
First, import all the needed external libraries and functions. Note the line
from vtkmodules.vtkFiltersSources import vtkLineSourceand
from vtkmodules.vtkFiltersCore import vtkTubeFilterwhich are used to represent a line as a tube, since a line (mathematically) has no diameter.
Python Setup
import math
import numpy as np

# noinspection PyUnresolvedReferences
import vtkmodules.vtkInteractionStyle
# noinspection PyUnresolvedReferences
import vtkmodules.vtkRenderingOpenGL2
from vtkmodules.vtkCommonColor import vtkNamedColors
from vtkmodules.vtkCommonTransforms import vtkTransform
from vtkmodules.vtkFiltersSources import vtkLineSource
from vtkmodules.vtkFiltersSources import vtkSphereSource
from vtkmodules.vtkFiltersCore import vtkTubeFilter
from vtkmodules.vtkRenderingAnnotation import vtkAxesActor
from vtkmodules.vtkRenderingCore import (
    vtkActor,
    vtkPolyDataMapper,
    vtkRenderWindow,
    vtkRenderWindowInteractor,
    vtkRenderer
)
The Rendering Pipeline
# Visualization Pipeline

# a renderer and render window
ren = vtkRenderer()
renWin = vtkRenderWindow()
renWin.SetWindowName('AISE 4025: point and axes')
renWin.SetSize( 640, 480 )
renWin.AddRenderer( ren )

# an interactor
iren = vtkRenderWindowInteractor()
iren.SetRenderWindow( renWin )

colors = vtkNamedColors()
Geometry
Let’s specify 2 vectors and add them together
Origin = np.array([0, 0, 0])
Point1 = np.array([ 3, 0, 0 ])
Point2 = np.array([ 0, 4, 0 ])
Point3 = Point1 + Point2
Representation of the Vector
line1 = vtkLineSource()
line1.SetPoint1( Origin.tolist() )
line1.SetPoint2( Point1.tolist() )

# A line is rendered as a line of 1-pixel wide, difficult to see.
# We are going to render it as a tube of a finite diameter instead.
tube1 = vtkTubeFilter()
tube1.SetInputConnection( line1.GetOutputPort() )
tube1.SetRadius( 0.1 )
tube1.SetNumberOfSides( 32 )

line1Mapper = vtkPolyDataMapper()
line1Mapper.SetInputConnection( tube1.GetOutputPort() )

line1Actor = vtkActor()
line1Actor.SetMapper( line1Mapper )
line1Actor.GetProperty().SetColor( colors.GetColor3d( 'Red') )
Representation of the Vector
line2 = vtkLineSource()
line2.SetPoint1( Origin.tolist() )
line2.SetPoint2( Point2.tolist() )

# A line is rendered as a line of 1-pixel wide, difficult to see.
# We are going to render it as a tube of a finite diameter instead.
tube2 = vtkTubeFilter()
tube2.SetInputConnection( line2.GetOutputPort() )
tube2.SetRadius( 0.1 )
tube2.SetNumberOfSides( 32 )

line2Mapper = vtkPolyDataMapper()
line2Mapper.SetInputConnection( tube2.GetOutputPort() )

line2Actor = vtkActor()
line2Actor.SetMapper( line2Mapper )
line2Actor.GetProperty().SetColor( colors.GetColor3d( 'Green') )
Representation of the Vector
The vector is the summation of the first two. When adding two vectors together, they are concatenated with each other: the origin of one vector is attached to the end of another.
lineSum = vtkLineSource()
lineSum.SetPoint1( Origin.tolist() )
lineSum.SetPoint2( (Point1 + Point2).tolist() )

# A line is rendered as a line of 1-pixel wide, difficult to see.
# We are going to render it as a tube of a finite diameter instead.
tubelineSum  = vtkTubeFilter()
tubelineSum .SetInputConnection( lineSum.GetOutputPort() )
tubelineSum .SetRadius( 0.1 )
tubelineSum .SetNumberOfSides( 32 )

lineSumMapper = vtkPolyDataMapper()
lineSumMapper.SetInputConnection( tubelineSum .GetOutputPort() )

lineSumActor = vtkActor()
lineSumActor.SetMapper( lineSumMapper )
lineSumActor.GetProperty().SetColor( colors.GetColor3d( 'Yellow') )
In another word, the vector, shown in green, needs to be translated to the end of the vector (hown in red)
line3 = vtkLineSource()
line3.SetPoint1( Point1.tolist() )
line3.SetPoint2( (Point1 + Point2).tolist() )

# A line is rendered as a line of 1-pixel wide, difficult to see.
# We are going to render it as a tube of a finite diameter instead.
tube3 = vtkTubeFilter()
tube3.SetInputConnection( line3.GetOutputPort() )
tube3.SetRadius( 0.1 )
tube3.SetNumberOfSides( 32 )

line3Mapper = vtkPolyDataMapper()
line3Mapper.SetInputConnection( tube3.GetOutputPort() )

line3Actor = vtkActor()
line3Actor.SetMapper( line3Mapper )
line3Actor.GetProperty().SetColor( colors.GetColor3d( 'Green') )
Add an x-y-z-axes to help us orient.
# add an 3D Axes
axes = vtkAxesActor()
axes.SetTotalLength( 10, 10, 10 )
axes.AxisLabelsOff()

# properties of the axes labels can be set as follows
# this sets the x axis label to red
axes.GetXAxisCaptionActor2D().GetCaptionTextProperty().SetColor(colors.GetColor3d('Red'));
axes.GetYAxisCaptionActor2D().GetCaptionTextProperty().SetColor(colors.GetColor3d('Green'));
axes.GetZAxisCaptionActor2D().GetCaptionTextProperty().SetColor(colors.GetColor3d('Blue'));
Add all actors into the render window
ren = vtkRenderer()
ren.AddActor( line1Actor )
ren.AddActor( line2Actor )
ren.AddActor( line3Actor )
ren.AddActor( lineSumActor )
ren.AddActor( axes )
ren.SetBackground( colors.GetColor3d('MidnightBlue'))
ren.SetBackground( 1, 1, 1 )

renWin = vtkRenderWindow()
renWin.AddRenderer(ren)
renWin.SetSize(640, 480)
renWin.SetWindowName('AISE 4025, Vectors Sum')

iren = vtkRenderWindowInteractor()
iren.SetRenderWindow(renWin)
renWin.Render()
iren.Start()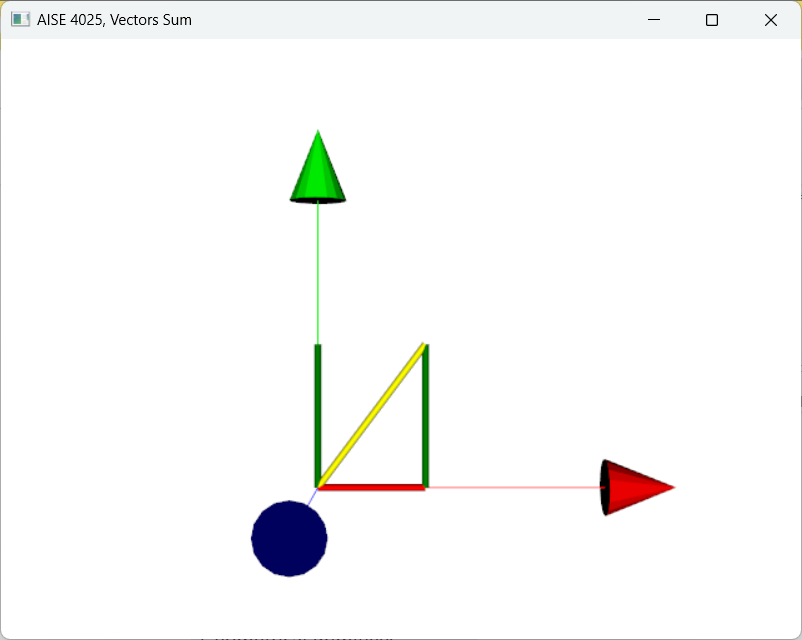
Figure 1:A point visualized as a red phere in 3D.