In this (third) tutorial, we are going to graphically visualize the operation of taking the cross product of two vectors.
More examples and tutorials can be found here
Cross Product
The cross product of two vectors and results in another vector that is perpendicular to both and :
where the direction of follows the RHR. Thus, cross product is anticommutative:
The cross product is defined by the formula
where
is the angle between and in the plane containing them (hence, it is between and )
and are the magnitudes (length) of the vectors and , and
is a unit vector that is perpendicular to both and . In other words, is the normal of the plain containing both and .
Vector is a direction with no fixed position
Mathmatically, a vector is used to specify the direction, or orientation, of an object (e.g. a line). As such, it has no fixed position in space. This is different than a line, where a line is specified as a fixed position and a orientation vector .
In this regard, the vector is often visualized as a line segment that has the fixed point at the origin.
Python Setup
import math
import numpy as np

# noinspection PyUnresolvedReferences
import vtkmodules.vtkInteractionStyle
# noinspection PyUnresolvedReferences
import vtkmodules.vtkRenderingOpenGL2
from vtkmodules.vtkCommonColor import vtkNamedColors
from vtkmodules.vtkCommonTransforms import vtkTransform
from vtkmodules.vtkFiltersSources import vtkLineSource
from vtkmodules.vtkFiltersSources import vtkSphereSource
from vtkmodules.vtkFiltersCore import vtkTubeFilter
from vtkmodules.vtkRenderingAnnotation import vtkAxesActor
from vtkmodules.vtkRenderingCore import (
    vtkActor,
    vtkPolyDataMapper,
    vtkRenderWindow,
    vtkRenderWindowInteractor,
    vtkRenderer
)
The Rendering Pipeline
# Visualization Pipeline

# a renderer and render window
ren = vtkRenderer()
renWin = vtkRenderWindow()
renWin.SetWindowName('AISE 4025: point and axes')
renWin.SetSize( 640, 480 )
renWin.AddRenderer( ren )

# an interactor
iren = vtkRenderWindowInteractor()
iren.SetRenderWindow( renWin )

colors = vtkNamedColors()
Geometry
Let’s specify 2 vectors, one oriented in the -axis, the other at -axis with some lengths. For visualization purposes, use the origin of the cartesian coordinate system so they can be visualized as a line segment.
Origin = np.array([ 5, 6, 0])
orientation_1 = np.array([ 3, 0, 0 ])
orientation_2 = np.array([ 7, 4, 0 ])

a = orientation_1
b = orientation_2
c = np.cross( a, b )Representation of the Vector
line_a = vtkLineSource()
line_a.SetPoint1( Origin.tolist() )
line_a.SetPoint2( (Origin + a).tolist() )

# A line is rendered as a line of 1-pixel wide, difficult to see.
# We are going to render it as a tube of a finite diameter instead.
tube_a = vtkTubeFilter()
tube_a.SetInputConnection( line_a.GetOutputPort() )
tube_a.SetRadius( 0.1 )
tube_a.SetNumberOfSides( 32 )

line_aMapper = vtkPolyDataMapper()
line_aMapper.SetInputConnection( tube_a.GetOutputPort() )

line_aActor = vtkActor()
line_aActor.SetMapper( line_aMapper )
line_aActor.GetProperty().SetColor( colors.GetColor3d( 'Red') )
Representation of the Vector
line_b = vtkLineSource()
line_b.SetPoint1( Origin.tolist() )
line_b.SetPoint2( (Origin + b).tolist() )

# A line is rendered as a line of 1-pixel wide, difficult to see.
# We are going to render it as a tube of a finite diameter instead.
tube_b = vtkTubeFilter()
tube_b.SetInputConnection( line_b.GetOutputPort() )
tube_b.SetRadius( 0.1 )
tube_b.SetNumberOfSides( 32 )

line_bMapper = vtkPolyDataMapper()
line_bMapper.SetInputConnection( tube_b.GetOutputPort() )

line_bActor = vtkActor()
line_bActor.SetMapper( line_bMapper )
line_bActor.GetProperty().SetColor( colors.GetColor3d( 'Green') )
Representation of the Vector
line_c = vtkLineSource()
line_c.SetPoint1( Origin.tolist() )
line_c.SetPoint2( (Origin + c).tolist() )

# A line is rendered as a line of 1-pixel wide, difficult to see.
# We are going to render it as a tube of a finite diameter instead.
tube_c = vtkTubeFilter()
tube_c.SetInputConnection( line_c.GetOutputPort() )
tube_c.SetRadius( 0.1 )
tube_c.SetNumberOfSides( 32 )

line_cMapper = vtkPolyDataMapper()
line_cMapper.SetInputConnection( tube_c.GetOutputPort() )

line_cActor = vtkActor()
line_cActor.SetMapper( line_cMapper )
line_cActor.GetProperty().SetColor( colors.GetColor3d( 'Blue') )
Add an axes
Add an x-y-z-axes to help us orient.
# add an 3D Axes
axes = vtkAxesActor()
axes.SetTotalLength( 10, 10, 10 )
axes.AxisLabelsOff()

# properties of the axes labels can be set as follows
# this sets the x axis label to red
axes.GetXAxisCaptionActor2D().GetCaptionTextProperty().SetColor(colors.GetColor3d('Red'));
axes.GetYAxisCaptionActor2D().GetCaptionTextProperty().SetColor(colors.GetColor3d('Green'));
axes.GetZAxisCaptionActor2D().GetCaptionTextProperty().SetColor(colors.GetColor3d('Blue'));
Add all actors into the render window
ren = vtkRenderer()
ren.AddActor( line_aActor )
ren.AddActor( line_bActor )
ren.AddActor( line_cActor )
ren.AddActor( axes )
ren.SetBackground( colors.GetColor3d('MidnightBlue'))
ren.SetBackground( 1, 1, 1 )

renWin = vtkRenderWindow()
renWin.AddRenderer(ren)
renWin.SetSize(640, 480)
renWin.SetWindowName('AISE 4025, Cross Product of Vectors')

iren = vtkRenderWindowInteractor()
iren.SetRenderWindow(renWin)
Draw to the renderer and start the user interaction
renWin.Render()
iren.Start()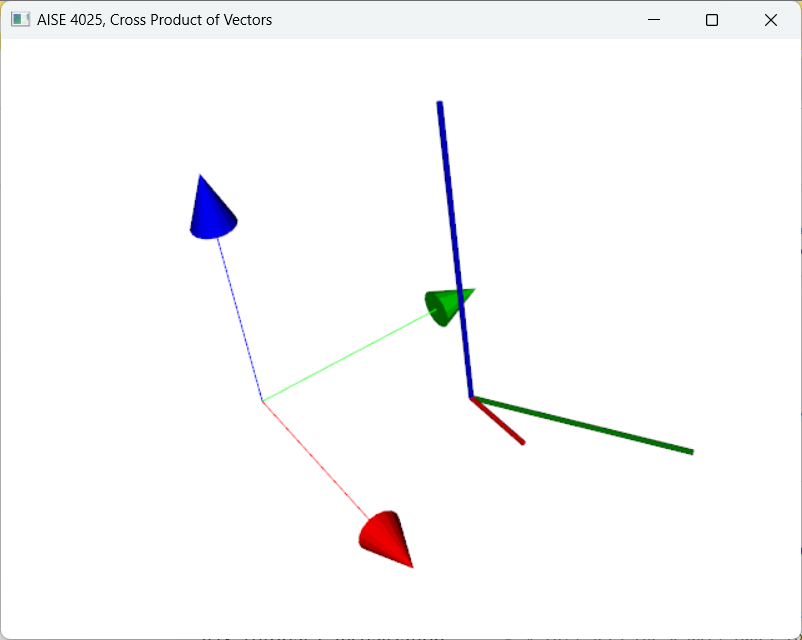
Figure 1:The cross product between the red vector with the green vector produces a blue vector that is perpendicular to both the red and green vectors.
Exercise
In fact, the origin for the purpose of visualization does not have to be at the origin of the coordinate system. To visualize the result of the cross product of two vectors, the origin in the code above can be simply a common point shared by both and .
change the values of the share point Origin and the direction of the vectors and ,
pay attention to the length of the vectors as visualized,
pay attention to the angles between each of these vectors,
write codes to determine the angles between these vectors and the length of each vectors.