In this (fourth) tutorial, we are going to graphically visualize the process of creating an orthonormal basis from 3 points.
More examples and tutorials can be found here
Orthonormal Basis
For the purpose of this work, an orthonormal basis is a cartesian coordinate system that is used to specify the pose (orientation and position) of a geometrical object. Given 3 points , , and , as long as they are not co-linear, an orthonormal basis can be created by taking successive cross products.
An orthonormal basis has an origin and 3 unit vectors specifying the orientation of the cartesian coordinate system, where each unit vector is perpendicular with the others. The origin, for convenience, is often chosen as one of the given point, or the COG of these 3 points.
Thus, the process of creating an orthonormal basis from 3 points , , and are:
define an origin
create a unit vector from point and ,
create a unit vector from point and ,
create a unit vector by taking the cross product between and . Note that is perpendicular to both and .
however, while is perpendicular to , is not necessarily perpendicular to . Computer a new by taking the cross product between and .
Python Setup
import math
import numpy as np

# noinspection PyUnresolvedReferences
import vtkmodules.vtkInteractionStyle
# noinspection PyUnresolvedReferences
import vtkmodules.vtkRenderingOpenGL2
from vtkmodules.vtkCommonColor import vtkNamedColors
from vtkmodules.vtkCommonTransforms import vtkTransform
from vtkmodules.vtkFiltersSources import vtkLineSource
from vtkmodules.vtkFiltersSources import vtkSphereSource
from vtkmodules.vtkFiltersCore import vtkTubeFilter
from vtkmodules.vtkRenderingAnnotation import vtkAxesActor
from vtkmodules.vtkRenderingCore import (
    vtkActor,
    vtkPolyDataMapper,
    vtkRenderWindow,
    vtkRenderWindowInteractor,
    vtkRenderer
)
The Rendering Pipeline
# Visualization Pipeline

# a renderer and render window
ren = vtkRenderer()
renWin = vtkRenderWindow()
renWin.SetWindowName('AISE 4025: Orthonormal Basis')
renWin.SetSize( 640, 480 )
renWin.AddRenderer( ren )

# an interactor
iren = vtkRenderWindowInteractor()
iren.SetRenderWindow( renWin )

colors = vtkNamedColors()a = np.array([ 1, 1, 0 ])
b = np.array([ 7, 0, 0 ])
c = np.array([ 7, 4, 0 ])
# use Centre of Gravity as the origin
Origin = (a+b+c)/3
First axis () is computed as the vector between point (Green) and (Red). Normalize it.
i = (b-a)/np.linalg.norm(b-a)
print(np.linalg.norm(i))
Second axis () is computed as the vector between point (blue) and (Red). Normalize it.
j = (c-a)/np.linalg.norm(c-a)
print(np.linalg.norm(j))k = np.cross(i,j)/np.linalg.norm( np.cross(i,j)) However, may not be perpendicular to !
Recompute the second axis (j) to make sure is perpendicular to both and
Note the order of the cross product. We use the RHR.
j = np.cross(k,i)
print(np.linalg.norm(j))
Draw a red sphere to represent
# point a
sphereASource = vtkSphereSource()
sphereASource.SetRadius( 0.5 )

sphereASource.SetCenter( a.tolist() )
pointAMapper = vtkPolyDataMapper()
pointAMapper.SetInputConnection( sphereASource.GetOutputPort() )
pointAActor = vtkActor()
pointAActor.SetMapper( pointAMapper )
pointAActor.GetProperty().SetColor( colors.GetColor3d( 'Red') )
Draw a green sphere to represent
# point b
sphereBSource = vtkSphereSource()
sphereBSource.SetRadius( 0.5 )

sphereBSource.SetCenter( b.tolist() )
pointBMapper = vtkPolyDataMapper()
pointBMapper.SetInputConnection( sphereBSource.GetOutputPort() )
pointBActor = vtkActor()
pointBActor.SetMapper( pointBMapper )
pointBActor.GetProperty().SetColor( colors.GetColor3d( 'Green') )
Draw a blue sphere to represent
# point c
sphereCSource = vtkSphereSource()
sphereCSource.SetRadius( 0.5 )

sphereCSource.SetCenter( c.tolist() )

pointCMapper = vtkPolyDataMapper()
pointCMapper.SetInputConnection( sphereCSource.GetOutputPort() )
pointCActor = vtkActor()
pointCActor.SetMapper( pointCMapper )
pointCActor.GetProperty().SetColor( colors.GetColor3d( 'Blue') )
Draw a red line to represent basis
line_i = vtkLineSource()
line_i.SetPoint1( Origin.tolist() )
line_i.SetPoint2( (Origin + i).tolist() )

# A line is rendered as a line of 1-pixel wide, difficult to see.
# We are going to render it as a tube of a finite diameter instead.
tube_i = vtkTubeFilter()
tube_i.SetInputConnection( line_i.GetOutputPort() )
tube_i.SetRadius( 0.1 )
tube_i.SetNumberOfSides( 32 )

line_iMapper = vtkPolyDataMapper()
line_iMapper.SetInputConnection( tube_i.GetOutputPort() )

line_iActor = vtkActor()
line_iActor.SetMapper( line_iMapper )
line_iActor.GetProperty().SetColor( colors.GetColor3d( 'Red') )
Draw a green line to represent basis
line_j = vtkLineSource()
line_j.SetPoint1( Origin.tolist() )
line_j.SetPoint2( (Origin + j).tolist() )

# A line is rendered as a line of 1-pixel wide, difficult to see.
# We are going to render it as a tube of a finite diameter instead.
tube_j = vtkTubeFilter()
tube_j.SetInputConnection( line_j.GetOutputPort() )
tube_j.SetRadius( 0.1 )
tube_j.SetNumberOfSides( 32 )

line_jMapper = vtkPolyDataMapper()
line_jMapper.SetInputConnection( tube_j.GetOutputPort() )

line_jActor = vtkActor()
line_jActor.SetMapper( line_jMapper )
line_jActor.GetProperty().SetColor( colors.GetColor3d( 'Green') )
Draw a blue line to represent basis
line_k = vtkLineSource()
line_k.SetPoint1( Origin.tolist() )
line_k.SetPoint2( (Origin + k).tolist() )

# A line is rendered as a line of 1-pixel wide, difficult to see.
# We are going to render it as a tube of a finite diameter instead.
tube_k = vtkTubeFilter()
tube_k.SetInputConnection( line_k.GetOutputPort() )
tube_k.SetRadius( 0.1 )
tube_k.SetNumberOfSides( 32 )

line_kMapper = vtkPolyDataMapper()
line_kMapper.SetInputConnection( tube_k.GetOutputPort() )

line_kActor = vtkActor()
line_kActor.SetMapper( line_kMapper )
line_kActor.GetProperty().SetColor( colors.GetColor3d( 'Blue') )
Add an axes
Add an x-y-z-axes to help us orient.
# add an 3D Axes
axes = vtkAxesActor()
axes.SetTotalLength( 10, 10, 10 )
axes.AxisLabelsOff()

# properties of the axes labels can be set as follows
# this sets the x axis label to red
axes.GetXAxisCaptionActor2D().GetCaptionTextProperty().SetColor(colors.GetColor3d('Red'));
axes.GetYAxisCaptionActor2D().GetCaptionTextProperty().SetColor(colors.GetColor3d('Green'));
axes.GetZAxisCaptionActor2D().GetCaptionTextProperty().SetColor(colors.GetColor3d('Blue'));
Add all actors into the render window
ren = vtkRenderer()
ren.AddActor( pointAActor )
ren.AddActor( pointBActor )
ren.AddActor( pointCActor )
ren.AddActor( line_iActor )
ren.AddActor( line_jActor )
ren.AddActor( line_kActor )
ren.AddActor( axes )
ren.SetBackground( colors.GetColor3d('MidnightBlue'))
ren.SetBackground( 1, 1, 1 )

renWin = vtkRenderWindow()
renWin.AddRenderer(ren)
renWin.SetSize(640, 480)
renWin.SetWindowName('AISE 4025, Orthonormal Basis')

iren = vtkRenderWindowInteractor()
iren.SetRenderWindow(renWin)
Draw to the renderer and start the user interaction
renWin.Render()
iren.Start()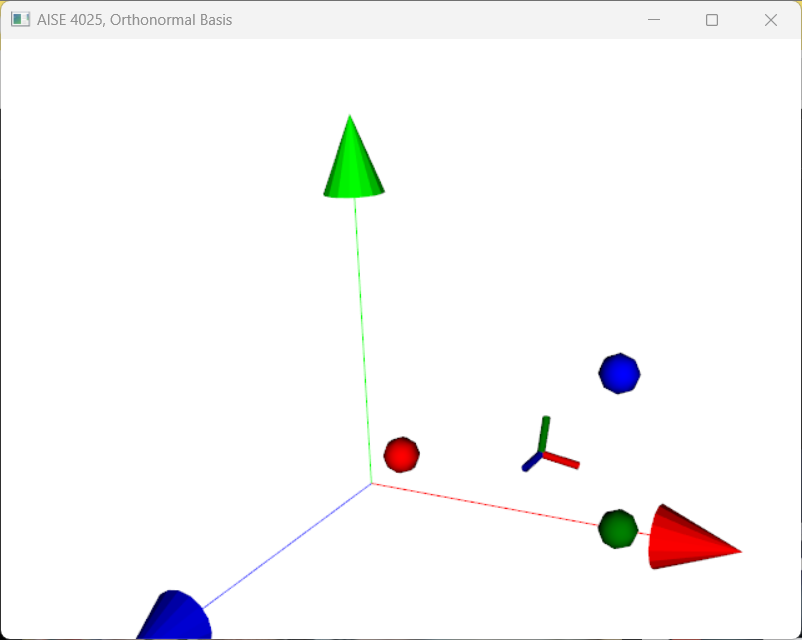
Figure 1:3 non-colinear points can be used to create an orthonormal basis by taking successive cross products.